
Introduction
IDA has debugging support for multiple architectures, such as Intel x86, ARM, PowerPC, MIPS, and, since IDA 7.4, Motorola 68k, Infineon TriCore, and Renesas RH850.
Some of these architectures are natively supported, either locally through IDA (x86-only), or remotely through the use of debugger servers (x86 and ARM). The other architectures listed above are supported through the GDB debugger in IDA.
The GDB debugger in IDA implements the GDB remote serial protocol, which is itself architecture-agnostic. It could theoretically be used by IDA to support any architecture through any program that implements a GDB stub. To name a few:
- gdbserver
- QEMU
- VMware
- Wine (fun fact: you can use Wine+GDB+IDA to debug Windows programs natively under Linux)
- OpenOCD
- Bochs
- Lauterbach’s TRACE32
- Wind River’s Simics
- MAME
But what if you want to debug another architecture, which your favorite GDB stub implements, but which still does not have debug support for IDA?
For that, you can edit IDA’s GDB debugger configuration and write your own IDA plugin to extend the processor module, by providing callbacks that make IDA aware of the architecture you want to debug.
And this is exactly what we will do in this post, improving the Z80 processor module to support remote debugging through the GDB stub in the Multiple Arcade Machine Emulator, which will allow us to debug pacman.
Adding an architecture to GDB debugger
The first step is to update the configuration file for IDA’s GDB debugger (dbg_gdb.cfg) and add a configuration for the new architecture.
--- cfg/dbg_gdb.cfg
+++ cfg/dbg_gdb.cfg
@@ -49,6 +49,7 @@ ARM_UPDATE_CPSR = 1

 // copied from idp.hpp
 #define PLFM_386         0        ///< Intel 80x86 (and x86_64/AMD64)
+#define PLFM_Z80         1        ///< 8085, Z80
 #define PLFM_68K         7        ///< Motorola 680x0
 #define PLFM_MIPS       12        ///< MIPS
 #define PLFM_ARM        13        ///< ARM (also includes AArch64)
@@ -95,6 +96,7 @@ CONFIGURATIONS =
   "MIPS64 Little-endian":    [ PLFM_MIPS,      0,        8,       0,         "mipsl",        "mips",             "mips64-linux.xml",      "0D000500", 0 ],
   "Motorola 68k":            [ PLFM_68K,       1,        4,       0,         "68k",          "m68k",             "m68k.xml",              "4E4F",     1 ],
   "Infineon TriCore":        [ PLFM_TRICORE,   0,        4,       0,         "tricore",      "tricore",          "tricore.xml",           "00A0",     1 ],
+  "Zilog Z80":               [ PLFM_Z80,       0,        4,       0,         "z80",          "z80",              "",                      "",         1 ],
   "Renesas RH850":           [ PLFM_NEC_V850X, 0,        4,       0,         "rh850",        "rh850",            "rh850.xml",             "40F8",     1 ]
 }

@@ -552,6 +554,7 @@ ARCH_MAP =
   "mips":             [ PLFM_MIPS,      -1,   -1,   -1 ],
   "m68k":             [ PLFM_68K,        0,    1,   -1 ],
   "tricore":          [ PLFM_TRICORE,    0,    0,   -1 ],
+  "z80":              [ PLFM_Z80,        0,    0,   -1 ],
   "rh850":            [ PLFM_NEC_V850X,  0,    0,   -1 ]
 }
The define for PLFM_Z80 is copied from idd.hpp.
The definition in CONFIGURATIONS does not provide an XML file with the register layout at the moment and does not provide the breakpoint instruction, since it does not exist for Z80.
The definition in ARCH_MAP specifies that the processor is not 64-bit, and that it is not big-endian.
This is the bare minimum you need to do to add a new architecture for debugging using GDB in IDA. It provides limited debugging capabilities, and may not work at all if the remote GDB stub does not provide register information or does not support single stepping.
In this specific case though it kind of works.
Start MAME with:
$ mame64 pacman -debugger gdbstub -debug
It will start and wait for a debugger to attach.
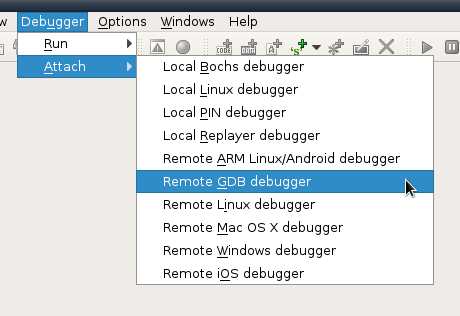
Then start IDA, and attach to MAME by going Debugger > Attach > Remote GDB debugger.
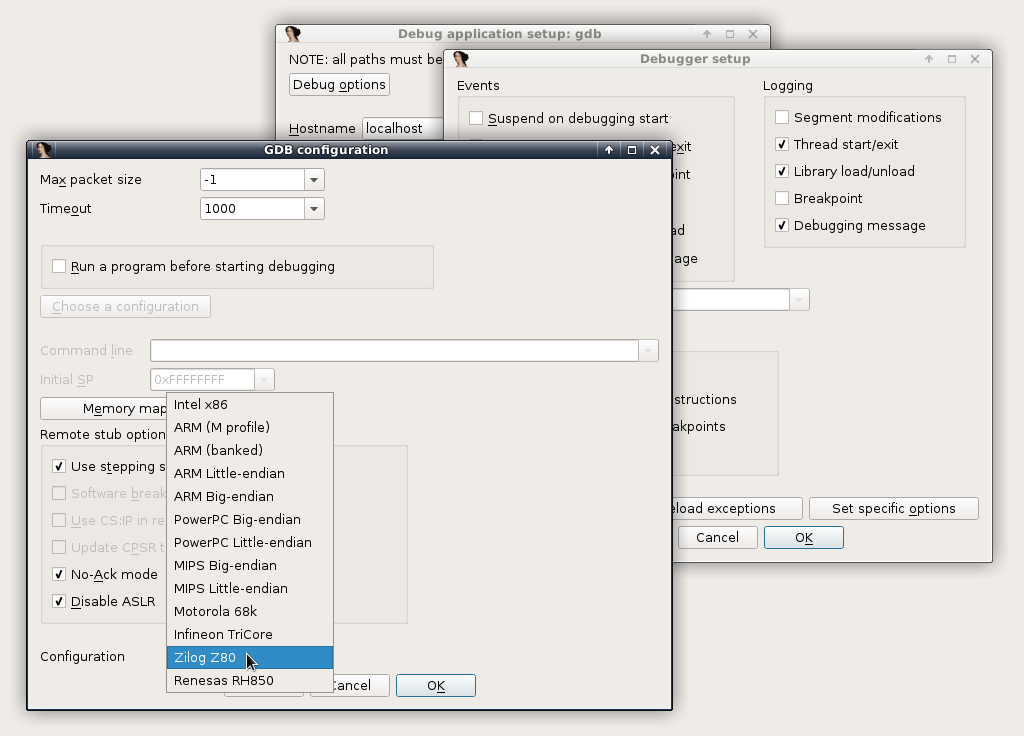
Set the hostname to localhost, click Debug options, Set specific options, and under the Configuration dropdown menu, select the Zilog Z80 configuration that we just added. Click OK (four times) to finally attach.
At this point you can single step (since this GDB stub does support single-stepping), continue, break, examine memory contents, use breakpoints, and a few more basic debugging commands.
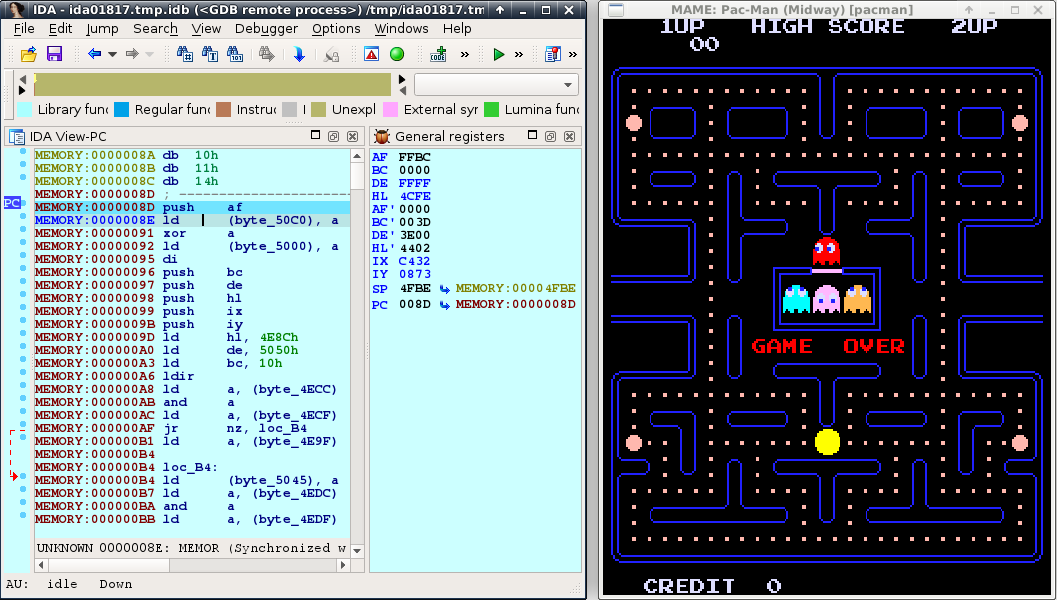
But we are missing many features, such as viewing individual flags in the F register, stepping over instructions, using register values in IDC/IDAPython scripts, and viewing hints in IDA to quickly navigate the disassembly.
Describing registers
If the remote GDB stub does not provide the register layout, IDA needs to have a default layout provided in form of XML files, which hopefully matches the layout from the remote GDB stub. For example, create the following file in cfg/z80.xml:
<?xml version="1.0"?>
<!DOCTYPE target SYSTEM "gdb-target.dtd">
<target version="1.0">
<architecture>z80</architecture>
  <feature name="mame.z80">
    <reg name="af" bitsize="16" type="int"/>
    <reg name="bc" bitsize="16" type="int"/>
    <reg name="de" bitsize="16" type="int"/>
    <reg name="hl" bitsize="16" type="int"/>
    <reg name="af'" bitsize="16" type="int"/>
    <reg name="bc'" bitsize="16" type="int"/>
    <reg name="de'" bitsize="16" type="int"/>
    <reg name="hl'" bitsize="16" type="int"/>
    <reg name="ix" bitsize="16" type="int"/>
    <reg name="iy" bitsize="16" type="int"/>
    <reg name="sp" bitsize="16" type="data_ptr"/>
    <reg name="pc" bitsize="16" type="code_ptr"/>
  </feature>
</target>
Note: The XML file above was provided by MAME itself over the serial protocol. This layout must match the one being used in the GDB stub. You might need to delve into the GDB stub implementation to get the proper register layout.
Now add the XML file to dbg_gdb.cfg, and also provide a better description of the Z80 registers (along with the bitfields for the flags register).
--- cfg/dbg_gdb.cfg
+++ cfg/dbg_gdb.cfg
@@ -96,7 +96,7 @@ CONFIGURATIONS =
   "MIPS64 Little-endian":    [ PLFM_MIPS,      0,        8,       0,         "mipsl",        "mips",             "mips64-linux.xml",      "0D000500", 0 ],
   "Motorola 68k":            [ PLFM_68K,       1,        4,       0,         "68k",          "m68k",             "m68k.xml",              "4E4F",     1 ],
   "Infineon TriCore":        [ PLFM_TRICORE,   0,        4,       0,         "tricore",      "tricore",          "tricore.xml",           "00A0",     1 ],
-  "Zilog Z80":               [ PLFM_Z80,       0,        4,       0,         "z80",          "z80",              "",                      "",         1 ],
+  "Zilog Z80":               [ PLFM_Z80,       0,        4,       0,         "z80",          "z80",              "z80.xml",               "",         1 ],
   "Renesas RH850":           [ PLFM_NEC_V850X, 0,        4,       0,         "rh850",        "rh850",            "rh850.xml",             "40F8",     1 ]
 }

@@ -480,6 +480,32 @@ IDA_FEATURES =
     }
   },

+  "z80":
+  {
+    "mame.z80":
+    {
+      "title": "General registers",
+      "code_ptr": "pc",
+      "stack_ptr": "sp",
+      "data_ptr":
+      [
+        "af",  "bc",  "de",  "hl",
+        "af'", "bc'", "de'", "hl'",
+        "ix",  "iy",  "sp",  "pc"
+      ],
+      "bitfields":
+      {
+        "af":
+        {
+          "C":   [0, 0],
+          "P/V": [2, 2],
+          "Z":   [6, 6],
+          "S":   [7, 7]
+        }
+      }
+    }
+  },
+
   "rh850":
   {
     "rh850.core":
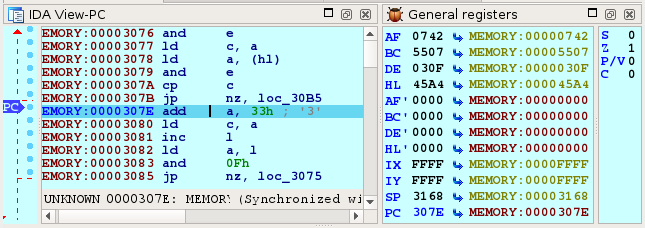
We can now see the flag bits in the General Registers window.
But to solve all other missing debugger features, we will have to create a plugin that extends the processor module for Z80.
Processor module extension skeleton
Using the IDA SDK, we will create a skeleton processor module extension. You may use the procext plugin as an example.
Inside the SDK, create the plugins/z80dbg/ directory.
Inside this new directory, create a makefile with these contents:
PROC=z80dbg

include ../plugin.mak
And a file named z80dbg.cpp with these contents:
#include <ida.hpp>
#include <idd.hpp>
#include <idp.hpp>

#include <loader.hpp>

//-------------------------------------------------------------------------
static ssize_t idaapi z80_debug_callback(void * /*user_data*/, int event_id, va_list va)
{
  // TODO process debug callbacks
  switch ( event_id )
  {
    case processor_t::ev_get_reg_info:
      break;
    case processor_t::ev_get_idd_opinfo:
      break;
    case processor_t::ev_next_exec_insn:
      break;
    case processor_t::ev_calc_step_over:
      break;
  }
  return 0;                     // event is not processed
}

//-------------------------------------------------------------------------
static int idaapi init(void)
{
  if ( ph.id != PLFM_Z80 )
    return PLUGIN_SKIP;
  hook_to_notification_point(HT_IDP, z80_debug_callback);
  return PLUGIN_KEEP;
}

//-------------------------------------------------------------------------
static void idaapi term(void)
{
  unhook_from_notification_point(HT_IDP, z80_debug_callback);
}

//-------------------------------------------------------------------------
static bool idaapi run(size_t)
{
  return true;
}

//-------------------------------------------------------------------------
static const char comment[] = "Z80 debugger processor extension";
static const char help[] =
  "Z80 debugger module\n"
  "\n"
  "This plugin extends the Z80 processor module to support debugging.\n";
static const char wanted_name[] = "Z80 debugger processor extension";
static const char wanted_hotkey[] = "";
plugin_t PLUGIN =
{
  IDP_INTERFACE_VERSION,
  PLUGIN_PROC,          // Load plugin when a processor module is loaded
  init,                 // Initialize plugin
  term,                 // Terminate plugin
  run,                  // Invoke plugin
  comment,              // Long comment about the plugin
  help,                 // Multiline help about the plugin
  wanted_name,          // The preferred short name of the plugin
  wanted_hotkey         // The preferred hotkey to run the plugin
};
This is the minimum amount of code we need to start creating our plugin. It adds a hook (z80_debug_callback()) which will be loaded whenever the Z80 processor module is loaded, and will handle processor module events (HT_IDP).
Now we build it in the command line with:
    $ cd plugins/z80dbg
    $ make
The plugin will be created in ../../bin/plugins/z80dbg.so. We copy that file over to IDA’s installation, under the plugins/ directory.
$ cp ../../bin/plugins/z80dbg.so ~/idapro-7.4/plugins/
Restart IDA and start debugging MAME again, and you should be able to see a new entry in Edit > Plugins > Z80 debugger processor extension.
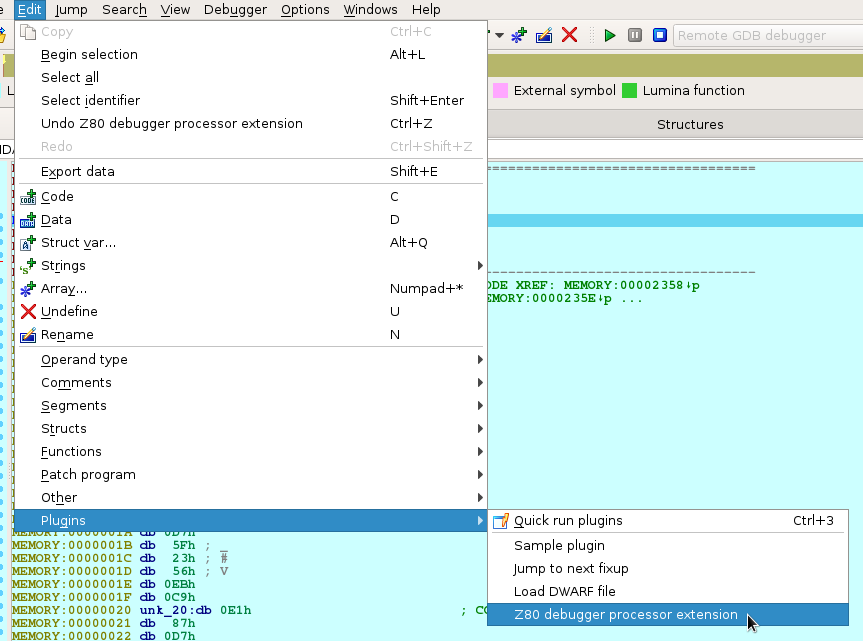
Congratulations! The plugin still does nothing, but it is already being run by IDA.
Adding register name information
The processor_t::ev_get_reg_info event requests more information about the register from the processor module, such as the width of the register, and whether it is made of a subset of a bigger register.
This is the case with Z80, where the GDB stub provides the AF register, but we want to access the A and the F registers individually.
First we implement the function that checks for substrings in the register names and returns bitfield information:
//-------------------------------------------------------------------------
static bool z80_get_reg_info(
        const char **main_regname,
        bitrange_t *bitrange,
        const char *regname)
{
  // Sanity checks.
  if ( regname == NULL || regname[0] == '\0' )
    return false;

  static const char *const subregs[][3] =
  {
    { "af",  "a",  "f"  },
    { "bc",  "b",  "c"  },
    { "de",  "d",  "e"  },
    { "hl",  "h",  "l"  },
    { "af'", "a'", "f'" },
    { "bc'", "b'", "c'" },
    { "de'", "d'", "e'" },
    { "hl'", "h'", "l'" },
    { "ix",  NULL, NULL },
    { "iy",  NULL, NULL },
    { "sp",  NULL, NULL },
    { "pc",  NULL, NULL },
  };

  // Check if we are dealing with paired or single registers and return
  // the appropriate information.
  for ( size_t i = 0; i < qnumber(subregs); i++ )
  {
    for ( size_t j = 0; j < 3; j++ )
    {
      if ( subregs[i][j] == NULL )
        break;
      if ( strieq(regname, subregs[i][j]) )
      {
        if ( main_regname != NULL )
          *main_regname = subregs[i][0];
        if ( bitrange != NULL )
        {
          switch ( j )
          {
            case 0: *bitrange = bitrange_t(0, 16); break;
            case 1: *bitrange = bitrange_t(8,  8); break;
            case 2: *bitrange = bitrange_t(0,  8); break;
          }
        }
        return true;
      }
    }
  }

  return false;
}
And then we implement a wrapper that parses the arguments for the event inside z80_debug_callback(), and call that function:
    case processor_t::ev_get_reg_info:
      {
        const char **main_regname = va_arg(va, const char **);
        bitrange_t *bitrange      = va_arg(va, bitrange_t *);
        const char *regname       = va_arg(va, const char *);
        return z80_get_reg_info(main_regname, bitrange, regname) ? 1 : -1;
      }
This function tells IDA that, for example, the F register is a subset of the AF register, and that it starts at offset 8, and is 8 bits long.
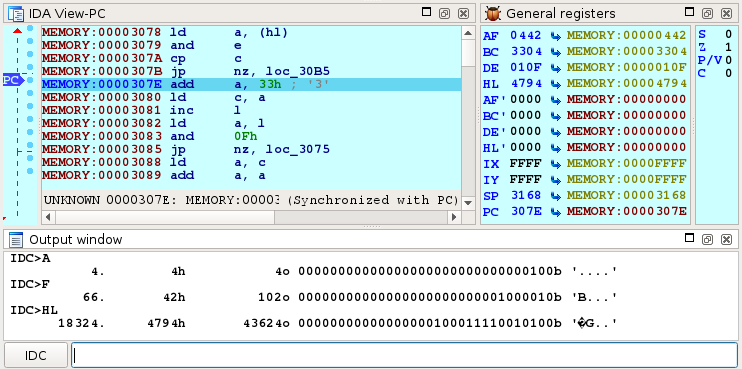
If we run the debugger again, we see that we can now access the register values from IDC/IDAPython scripts. We can even access the individual register values from the paired registers:
Getting more information on operands
The processor_t::ev_get_idd_opinfo event requests more information about an operand in the listing. It is very helpful to quickly show values of registers or memory by hovering the mouse over the operand, and to quickly jump to a location pointed by an operand by double-clicking on it.
First implement the function:
//-------------------------------------------------------------------------
typedef const regval_t &idaapi getreg_t(const char *name, const regval_t *regvalues);

//-------------------------------------------------------------------------
static sval_t named_regval(
        const char *regname,
        getreg_t *getreg,
        const regval_t *rv)
{
  // Get register info.
  const char *main_regname;
  bitrange_t bitrange;
  if ( !z80_get_reg_info(&main_regname, &bitrange, regname) )
    return 0;

  // Get main register value and apply bitrange.
  sval_t ret = getreg(main_regname, rv).ival;
  ret >>= bitrange.bitoff();
  ret &= (1ULL << bitrange.bitsize()) - 1;
  return ret;
}

//-------------------------------------------------------------------------
static sval_t regval(
        const op_t &op,
        getreg_t *getreg,
        const regval_t *rv)
{
  // Check for bad register number.
  if ( op.reg > ph.regs_num )
    return 0;
  return named_regval(ph.reg_names[op.reg], getreg, rv);
}

//-------------------------------------------------------------------------
static bool z80_get_operand_info(
        idd_opinfo_t *opinf,
        ea_t ea,
        int n,
        getreg_t *getreg,
        const regval_t *regvalues)
{
  // No Z80 instruction has operand number greater than 2.
  if ( n < 0 || n > 2 )
    return false;

  // Decode instruction at ea.
  insn_t insn;
  if ( decode_insn(&insn, ea) < 1 )
    return false;

  // Check the instruction features to see if the operand is modified.
  opinf->modified = has_cf_chg(insn.get_canon_feature(), n);

  // Get operand value (possibly an ea).
  uint64 v = 0;
  const op_t &op = insn.ops[n];
  switch ( op.type )
  {
    case o_reg:
      // We use the getreg function (along with regvalues) to retrieve
      // the value of the register specified in op.reg.
      v = regval(op, getreg, regvalues);
      break;
    case o_mem:
    case o_near:
      // Memory addresses are stored in op.addr.
      opinf->ea = op.addr;
      break;
    case o_phrase:
      // Memory references using register value.
      opinf->ea = regval(op, getreg, regvalues);
      break;
    case o_displ:
      // Memory references using register and address value.
      opinf->ea = regval(op, getreg, regvalues) + op.addr;
      break;
    case o_imm:
      // Immediates are stored in op.value.
      v = op.value;
      break;
    default:
      return false;
  }
  opinf->value._set_int(v);
  opinf->value_size = get_dtype_size(op.dtype);

  return true;
}
And then implement the wrapper for z80_debug_callback():
    case processor_t::ev_get_idd_opinfo:
      {
        idd_opinfo_t *opinf       = va_arg(va, idd_opinfo_t *);
        ea_t ea                   = va_arg(va, ea_t);
        int n                     = va_arg(va, int);
        int thread_id             = va_arg(va, int);
        getreg_t *getreg          = va_arg(va, getreg_t *);
        const regval_t *regvalues = va_arg(va, const regval_t *);
        qnotused(thread_id);
        return z80_get_operand_info(opinf, ea, n, getreg, regvalues) ? 1 : 0;
      }
What the function does is decode the instruction and get the current value of the specified operand number. This might require reading registers or memory values.
This function is tricky since it depends a lot on how the processor module represents each operand. Normally you will deal with default operand types such as o_reg, o_mem, o_near, o_phrase, o_displ, and o_imm, but you might have to deal with custom operand types (o_idpspec0 and such). In this case, it is better to have the source code of the processor module to verify how each operand was assigned.
When you don’t know how the operands are represented, it helps to break every time the function is passed an unknown operand. It is particularly helpful to check the value of ph.instruc[insn.itype], so you know which instruction you are dealing with and which features it has (see struct instruc_t from idp.hpp).
We can now hover the mouse on the operand and quickly get hints with the value of the memory at the address pointed to by (hl).
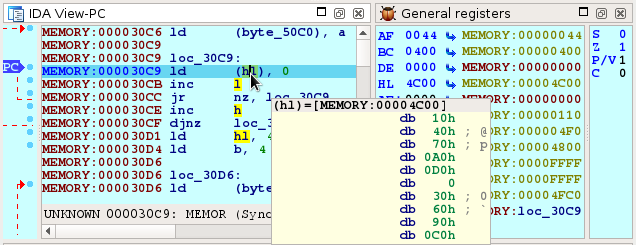
Also note that not only hl, but also the h and l registers are highlighted, due to the previous processor_t::ev_get_reg_info event.
Single-stepping support
Some GDB stubs support a command to single-step. But for stubs that do not implement single-stepping, IDA must know where the program counter will end up after one instruction so it may place a breakpoint there.
A conditional jump instruction, for example, may either jump to the specified address or continue execution at the next instruction.
We must inform IDA of all the instructions that may change the control flow, and figure out at run-time what is the next instruction that will be executed. This might also require reading registers or memory values.
The control-flow instructions for the Z80 are rather simple:
//-------------------------------------------------------------------------
static ea_t z80_next_exec_insn(
        ea_t ea,
        getreg_t *getreg,
        const regval_t *regvalues)
{
  // Decode instruction at ea.
  insn_t insn;
  if ( decode_insn(&insn, ea) < 1 )
    return BADADDR;

  // Get next address to be executed.
  ea_t target = BADADDR;
  switch ( insn.itype )
  {
    case Z80_jp:
    case Z80_jr:
    case Z80_call:
      if ( z80_check_cond(insn.Op1.reg, getreg, regvalues) )
      {
        if ( insn.Op2.type == o_near )
          target = insn.Op2.addr;
        else if ( insn.Op2.type == o_phrase )
          target = regval(insn.Op2, getreg, regvalues);
      }
      break;

    case Z80_djnz:
      {
        uint8_t B = named_regval("B", getreg, regvalues);
        if ( (B-1) != 0 )
          target = insn.Op1.addr;
      }
      break;

    case Z80_ret:
      if ( !z80_check_cond(insn.Op1.reg, getreg, regvalues) )
        break;
      // fallthrough
    case Z80_reti:
    case Z80_retn:
      {
        uint16_t SP = named_regval("SP", getreg, regvalues);
        target = get_word(SP);
      }
      break;
  }

  return target;
}
And then implement the wrapper for z80_debug_callback():
    case processor_t::ev_next_exec_insn:
      {
        ea_t *target              = va_arg(va, ea_t *);
        ea_t ea                   = va_arg(va, ea_t);
        int tid                   = va_arg(va, int);
        getreg_t *getreg          = va_arg(va, getreg_t *);
        const regval_t *regvalues = va_arg(va, const regval_t *);
        qnotused(tid);
        *target = z80_next_exec_insn(ea, getreg, regvalues);
        return 1;
      }
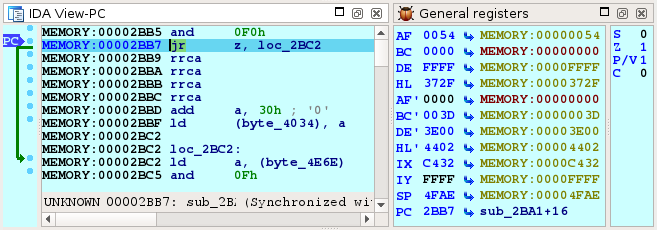
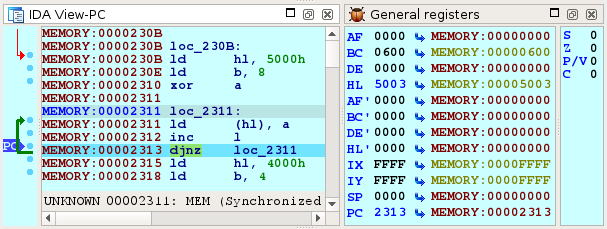
IDA also uses this information to provide visual cues of the control flow of the debuggee. In the listing window, we get a green arrow pointing to the next instruction to be executed.
Step-over support
The last event we need to implement for debugging support is processor_t::ev_calc_step_over. It is used to tell IDA which instructions should be stepped over. This usually involves the instructions that call functions and some specific loop instructions (such as djnz in the Z80).
//-------------------------------------------------------------------------
static ea_t z80_calc_step_over(ea_t ip)
{
  insn_t insn;
  if ( ip == BADADDR || decode_insn(&insn, ip) < 1 )
    return BADADDR;

  // Allow stepping over call instructions and djnz.
  bool step_over = is_call_insn(insn)
                || insn.itype == Z80_djnz;
  if ( step_over )
    return insn.ea + insn.size;

  return BADADDR;
}
And then implement the wrapper for z80_debug_callback():
    case processor_t::ev_calc_step_over:
      {
        ea_t *target = va_arg(va, ea_t *);
        ea_t ip      = va_arg(va, ea_t);
        *target = z80_calc_step_over(ip);
        return 1;
      }
Now we can easily break out of this loop (that would take another six iterations) by stepping over the djnz instruction.
Conclusion
We have successfully extended the Z80 processor module with debugging support.
For a quick example, let’s access the pacman level 256 glitch using MAME over GDB (more information about the technical aspects of the glitch can be found at [1] [2])
1. Attach to pacman
2. Go to address 0x2BF0, create an instruction (press C), and add a breakpoint (press F2)
3. Resume execution (press F9)
4. Insert a coin and start the game
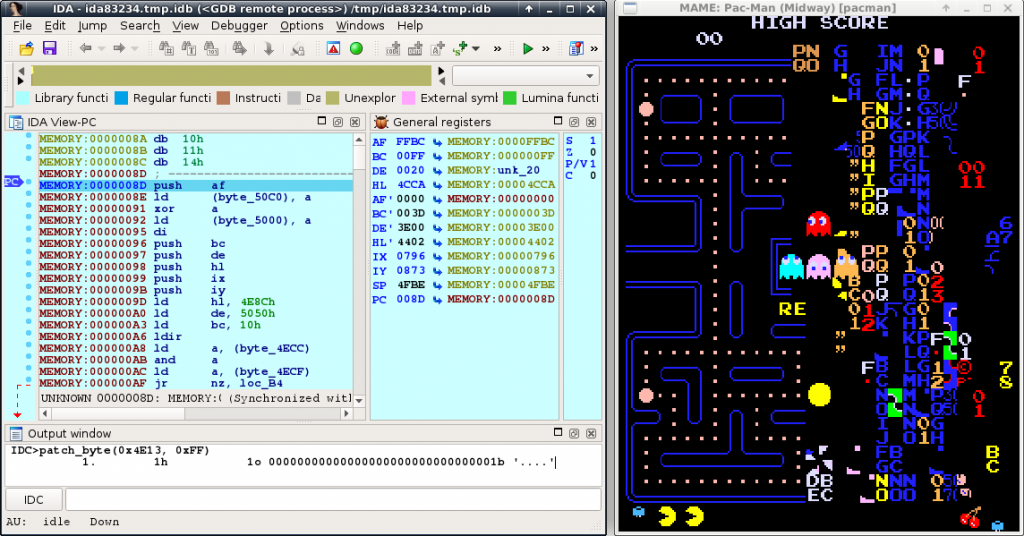
5. When the breakpoint hits, patch the memory with this IDC command:patch_byte(0x4E13, 0xFF)
6. Remove the breakpoint at address 0x2BF0
7. Resume execution
8. Enjoy pacman at level 256!
The full source code for the plugin can be found at /wp-content/uploads/2019/11/z80dbg.zip